Introduction and Data Science Process
Introduction and Data Science Process
Data Science : What is it?
data 1 :
(usually used with a singular verb) Digital Technology. information in digital format, as encoded text or numbers, or multimedia images, audio, or video.
(used with a singular verb) a body of facts; information.
(used with a plural verb) individual facts, statistics, or items of information.
science 2 :
a branch of knowledge or study dealing with a body of facts or truths systematically arranged and showing the operation of general laws.
systematic knowledge of the physical or material world gained through observation and experimentation.
any of the branches of natural or physical science.
Data
![]()
What is Data?
… We may have to come back to this one.
Science
![]()
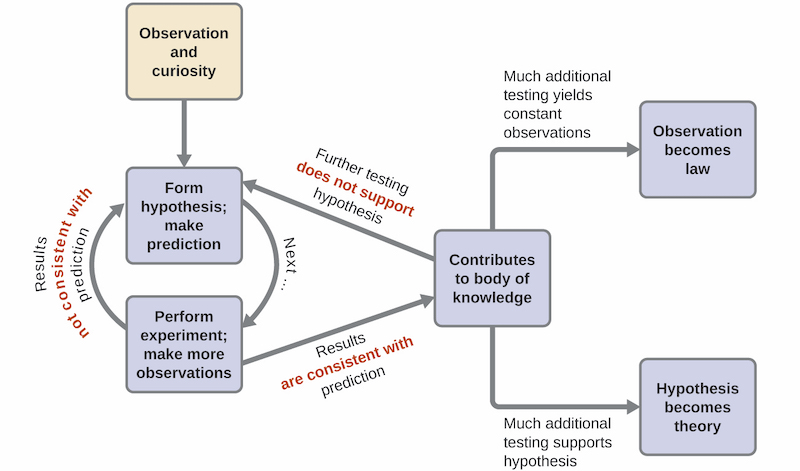
Scientific Method
Computational and Inferential Thinking Ch 1
What is Data Science 1
Data Science is about drawing useful conclusions from large and diverse data sets through exploration, prediction, and inference. Exploration involves identifying patterns in information. Prediction involves using information we know to make informed guesses about values we wish we knew. Inference involves quantifying our degree of certainty: will the patterns that we found in our data also appear in new observations? How accurate are our predictions? Our primary tools for exploration are visualizations and descriptive statistics, for prediction are machine learning and optimization, and for inference are statistical tests and models.
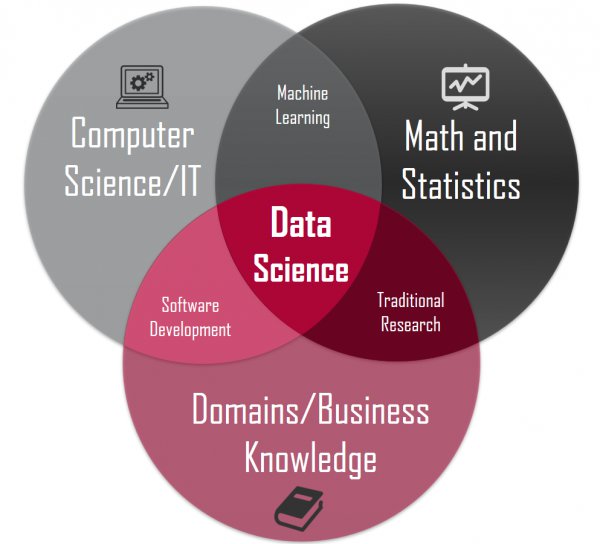
Statistics is a central component of data science because statistics studies how to make robust conclusions based on incomplete information. Computing is a central component because programming allows us to apply analysis techniques to the large and diverse data sets that arise in real-world applications: not just numbers, but text, images, videos, and sensor readings. Data science is all of these things, but it is more than the sum of its parts because of the applications. Through understanding a particular domain, data scientists learn to ask appropriate questions about their data and correctly interpret the answers provided by our inferential and computational tools.1
![]()
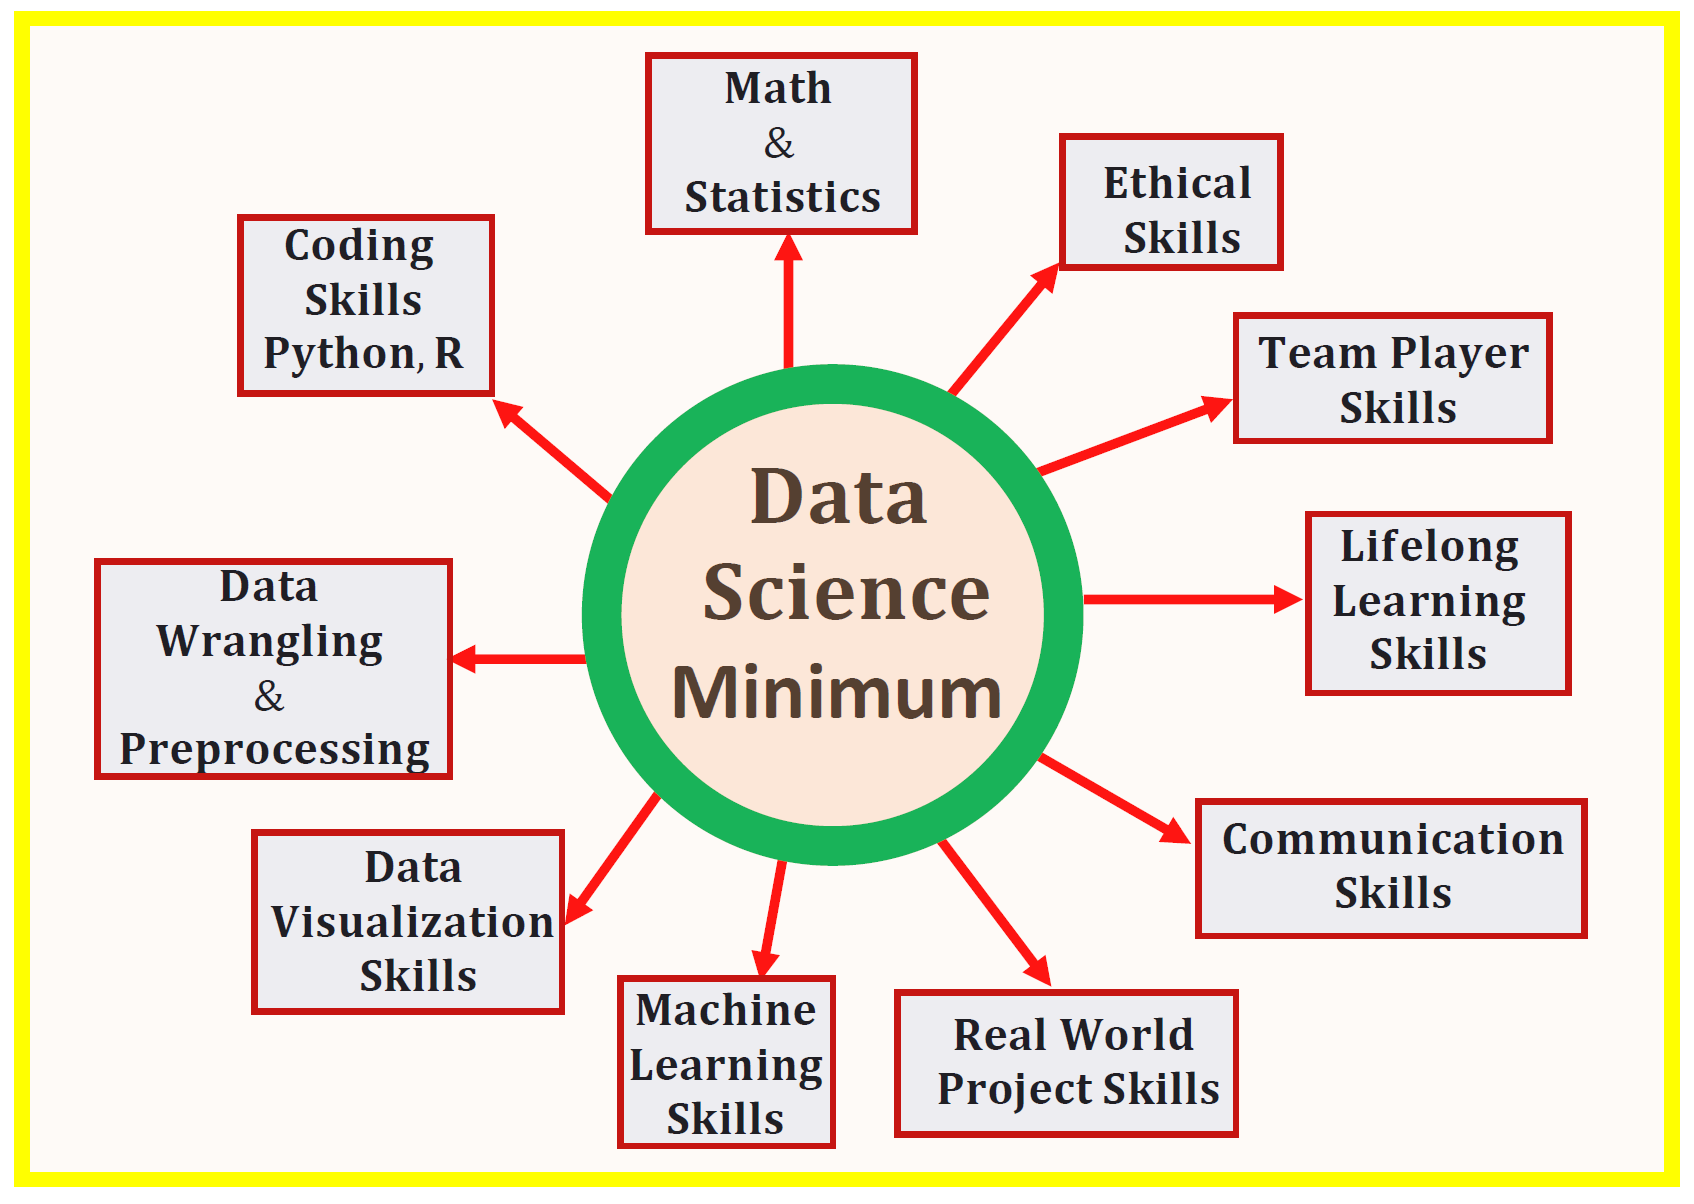
Data Science Skills Venn Diagram
![]()
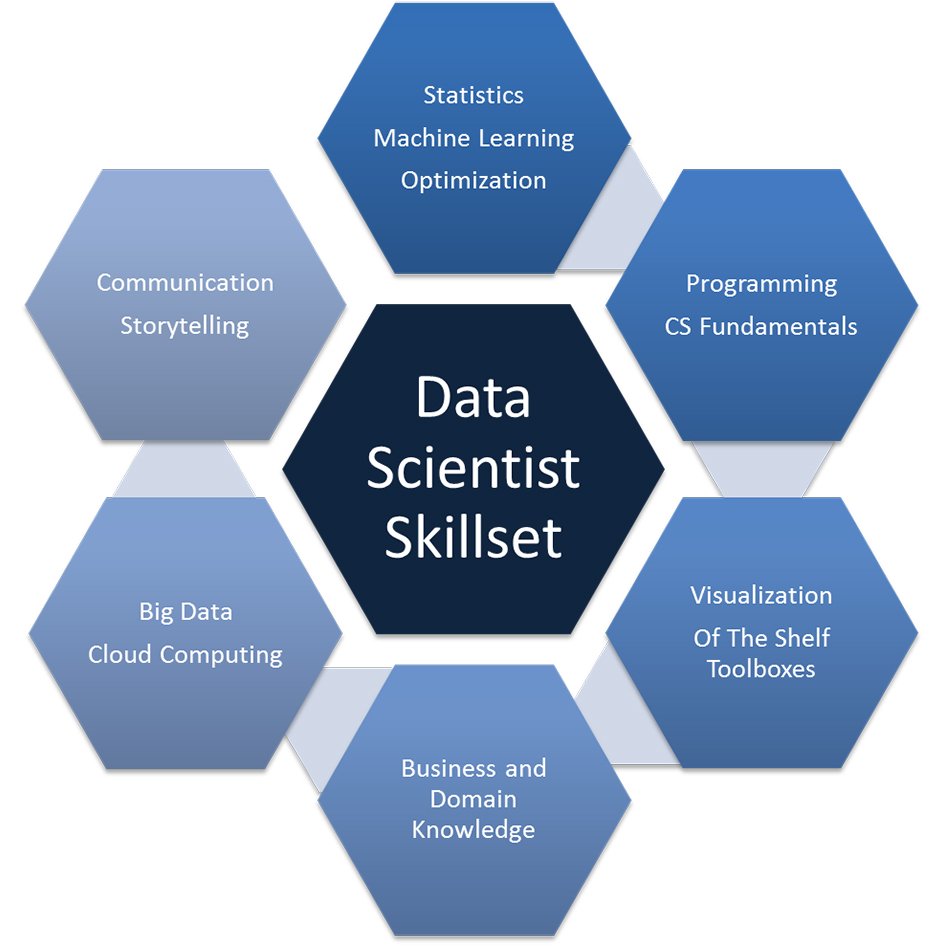
Data Science Skills
![]()
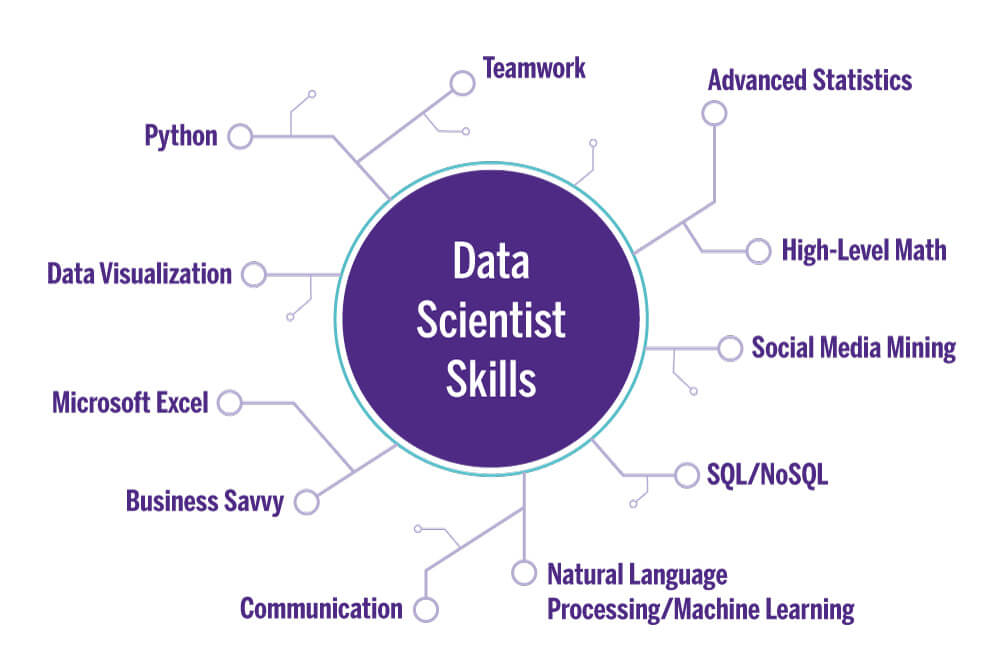
Data Science Skills
![]()
Data Science Skills
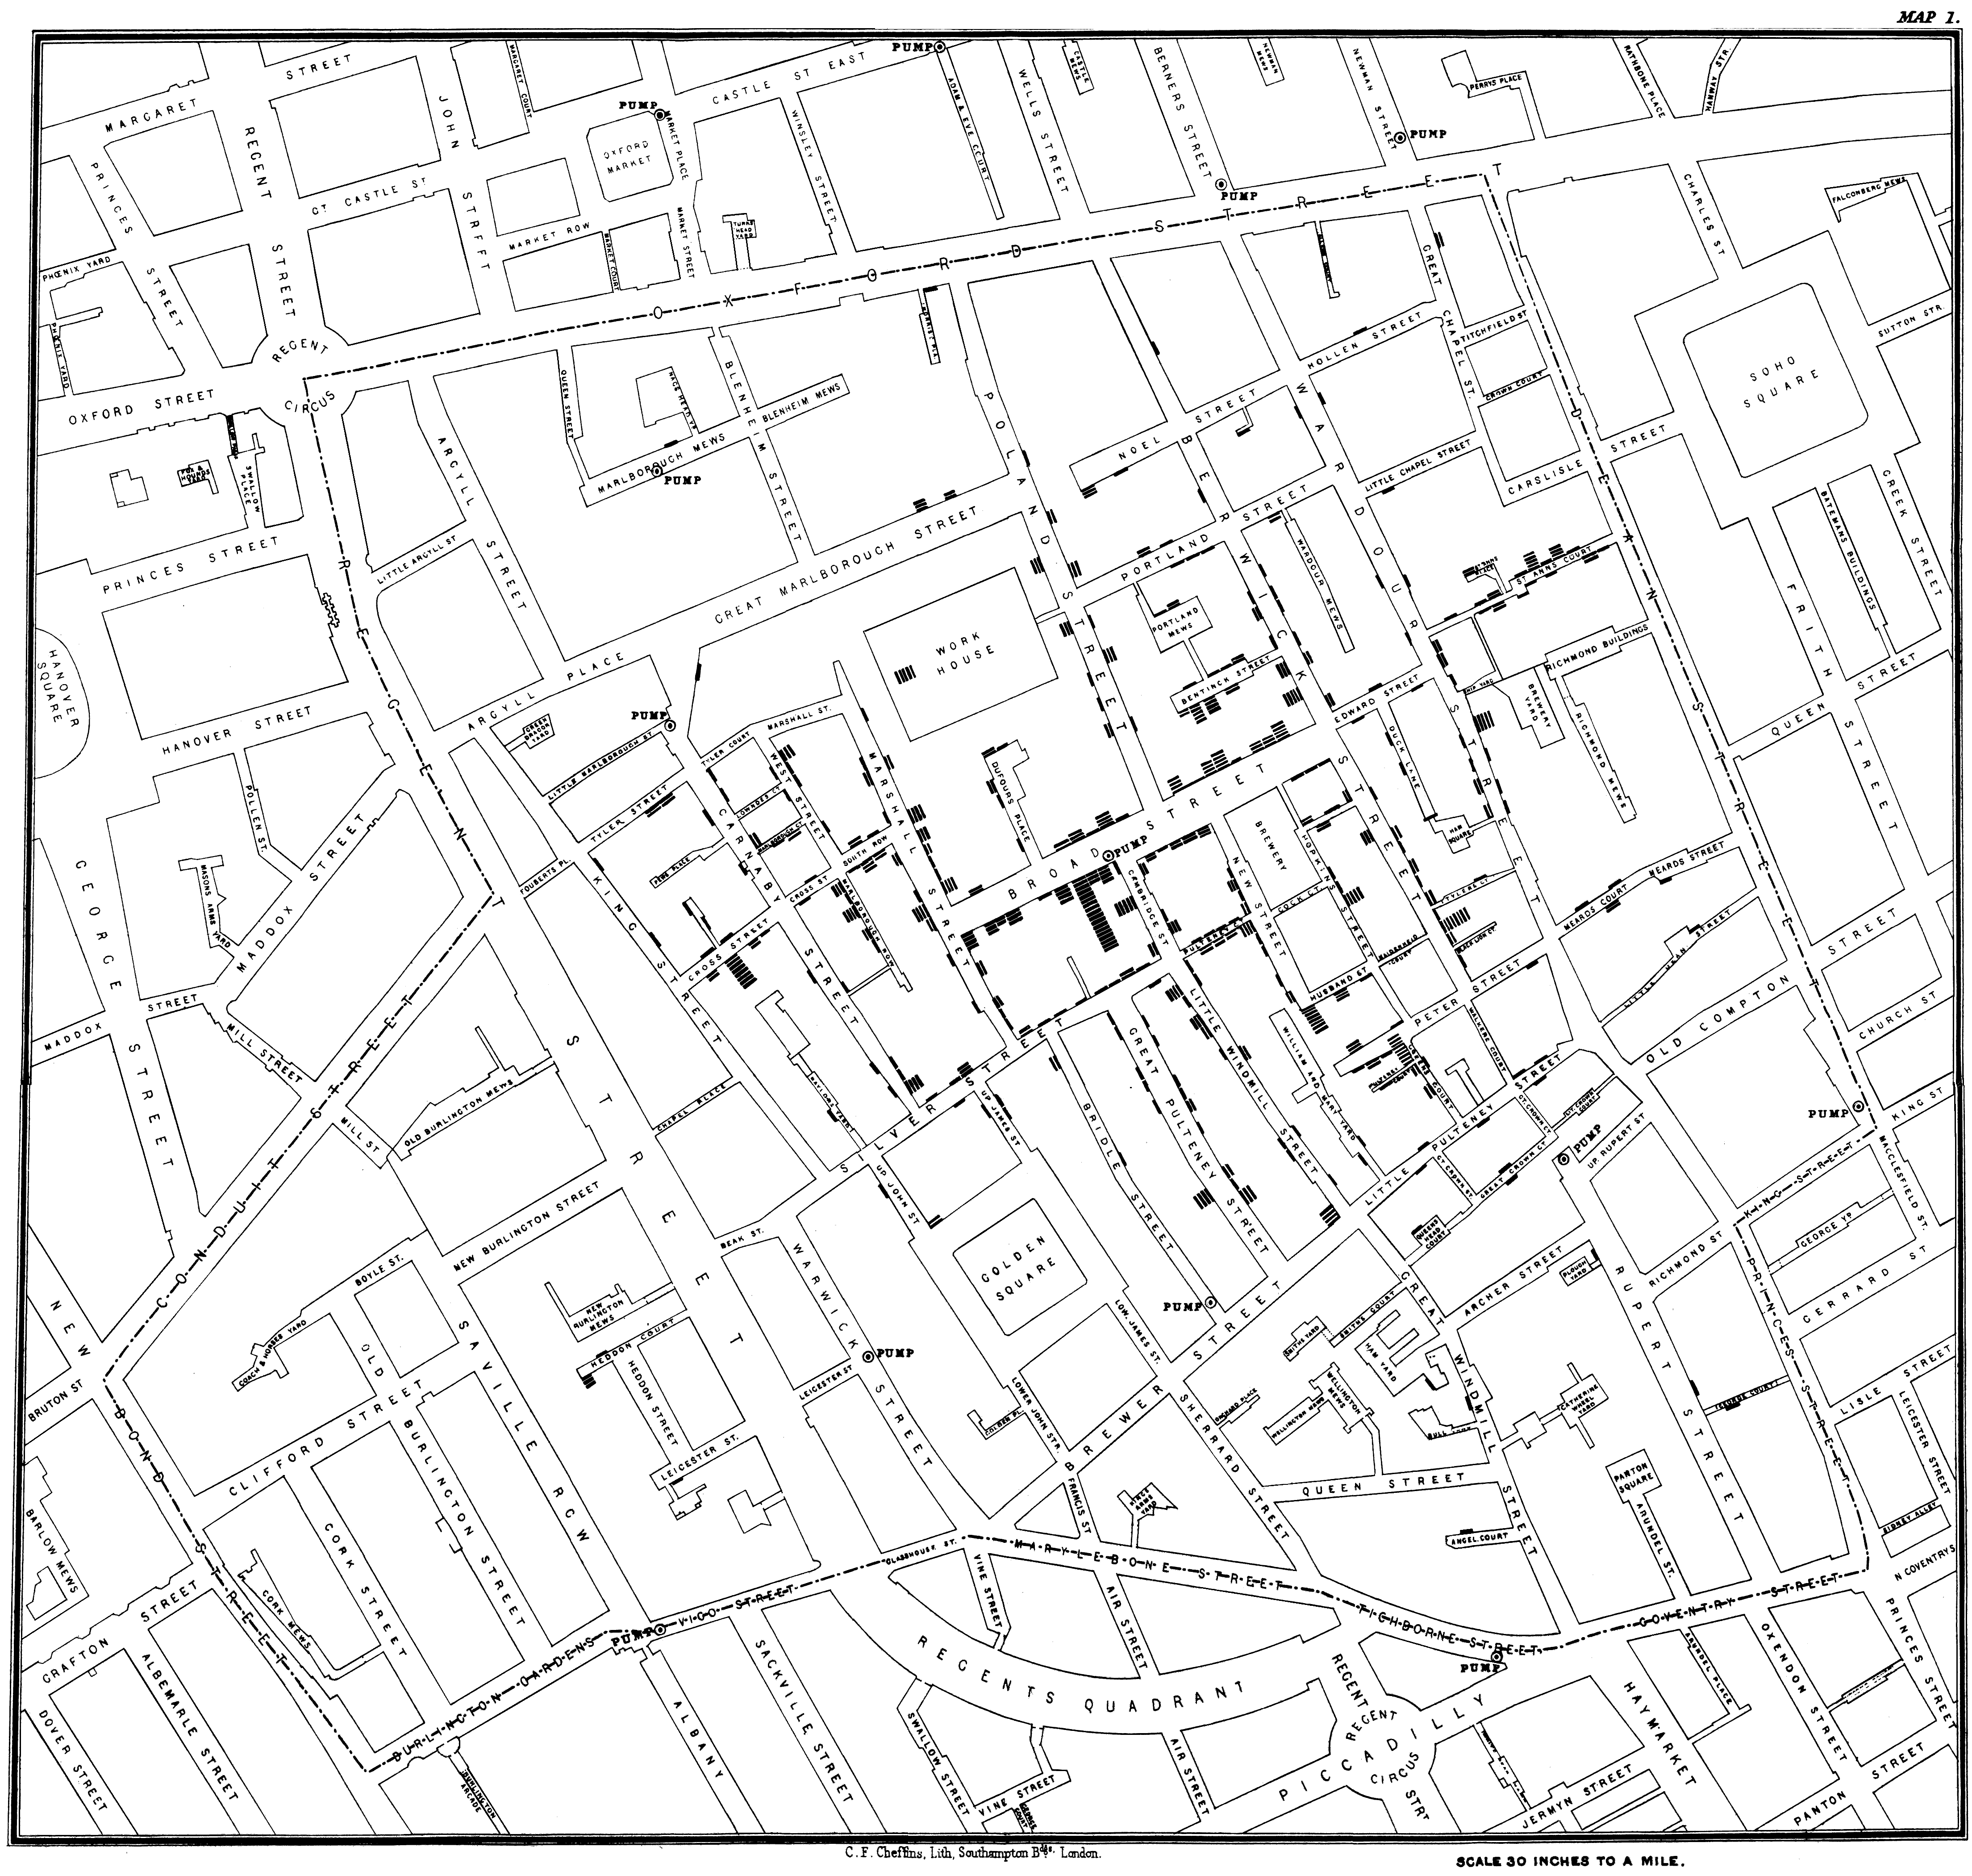
John Snow and the Broad Street Pump
![]()
Snow’s Map, 1854 London Cholera Cases
John Snow and the Broad Street Pump
![]()
Snow’s Map, 1854 London Cholera Cases
John Snow and the Broad Street Pump
![]()
Snow’s Map, 1854 London Cholera Cases
The “Grand Experiment”
![]()
Water Supply Companies, Coverage Areas
The “Grand Experiment”
Here’s some tabular data:
| S&V |
40,046 |
1,263 |
315 |
| Lambeth |
26,107 |
98 |
37 |
| Rest of London |
256,423 |
1,422 |
59 |
Establishing Causality
Any relation between the treatment and the outcome is called an association.
If the treatment causes the outcome to occur, then the association is causal.
Traditional statistical data analysis methods in general are not well suited to establishing causal associations. In retrospective analyses, we can usually show only associations, then later experiments are conducted to establish causality.
Thus, we often use the mantra “Correlation does not imply Causation” as a warning to ourselves (and others) that we cannot necessarily conclude that an association is necessarily causal, at least in the direction and for the reasons we might first assume.
Establishing Causality
To truly establish causality, the gold standard historically is the randomized controlled trial.†
John Snow’s experiment was the first documented example of a controlled trial directed at epidemiology (a field that was founded later).
- Control Group / Treatment Group
A crucial element in Snow’s analysis was that the people in the two groups were comparable to each other, apart from the treatment.
Control Group - The treatment is not applied to this group.
Treatment Group - The treatment is applied to this group.
Establishing Causality
- Beware of confounding factors!
In an observational study, if the treatment and control groups differ in ways other than the treatment, it is difficult to make conclusions about causality.
An underlying difference between the two groups (other than the treatment) is called a confounding factor, because it might confound you (that is, mess you up) when you try to reach a conclusion.
- Coffee and Lung Cancer?
- Studies in the 1960’s showed that coffee drinkers had higher rates of lung cancer than those who did not drink coffee.
Oops - Coffee drinkers tended to be smokers!
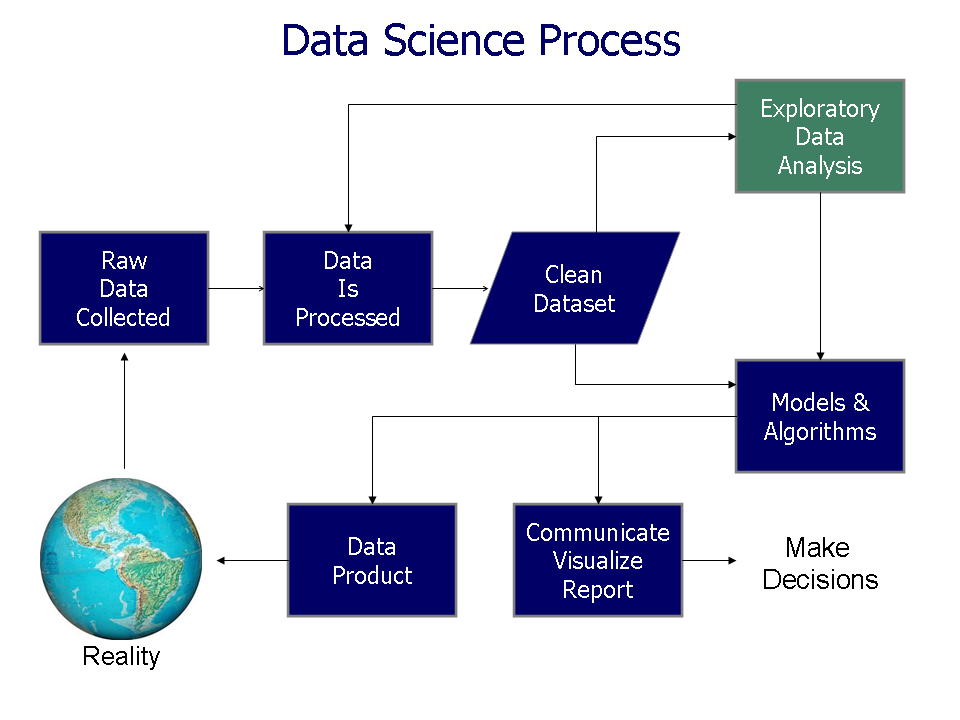
Data Science Process
![]()
The Data Science Process